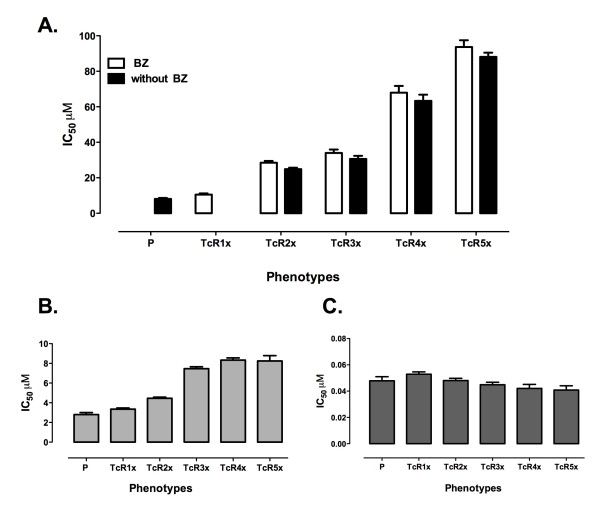
Figure 1.
IC50 to BZ, NFX and G418 in the BZ-sensitive and -resistant T. cruzi populations. A. IC50 to BZ of T. cruzi epimastigotes of sensitive strain (P) and five resistant phenotypes (TcR1x-TcR5x) induced by stepwise concentrations of BZ; the white bars represent the IC50 with BZ treatment and the black bars without drug pressure over the long term. B. IC50 to NFX of P and five BZ-resistant phenotypes C. IC50 to G418 of P- and BZ-resistant lines. Statistically significant differences in IC50 between the parental strain and the resistant phenotypes were tested with ANOVA analysis (p < 0.05).

