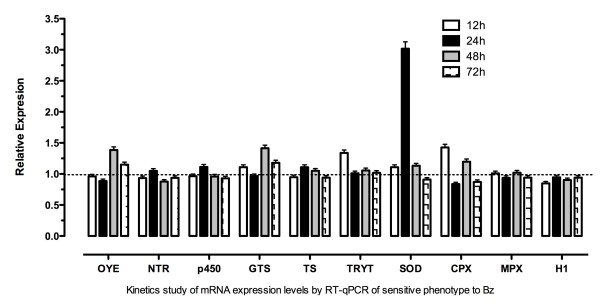
Figure 3.
Relative quantification by RT-qPCR of mRNA expression levels of ten genes in sensitive parasites exposed to 50 μM of BZ and evaluated at different times (12 h, 24 h, 48 h and 72 h) compared with 0 h and normalized with the expression of the reference gene (HGPRT). The relative quantification results were obtained using the REST2009 program by randomization test with 10,000 permutations (p < 0.05). The graph shows the data of each gene evaluated for each of the times in triplicate and two independent experiments.

