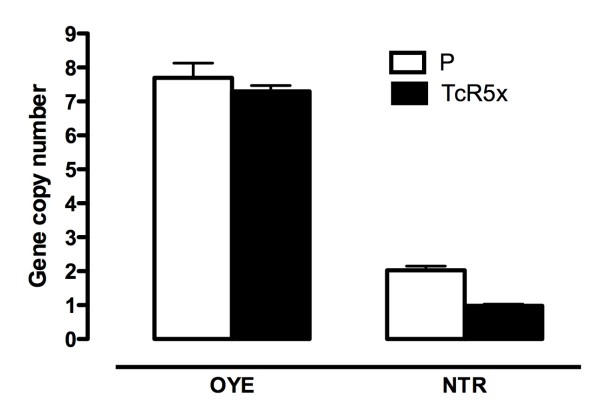
Figure 4.
Number of copies of OYE and NTR genes using qPCR for the sensitive parental (P) strain (white bars) and the resistant phenotype TcR5x (black bars). The relative quantification was normalized using the single copy gene HGPRT. The results correspond to analyses in duplicate in two independent assays.

