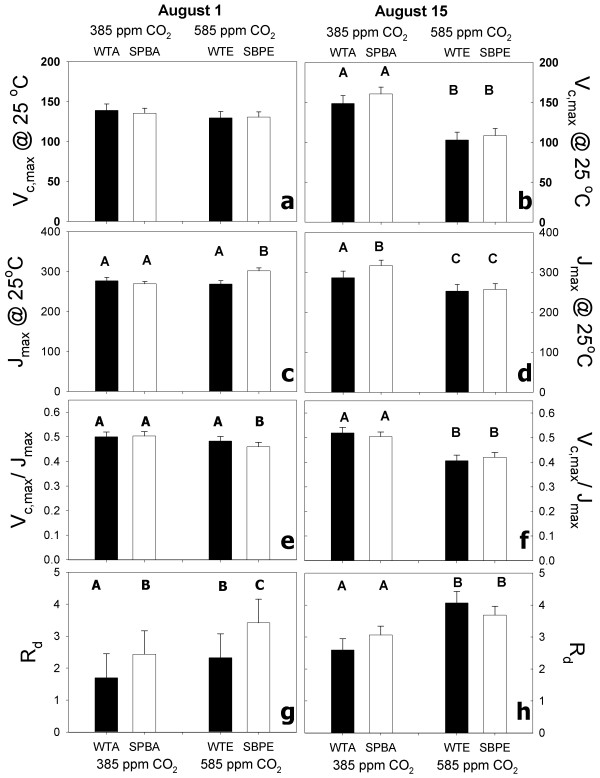
Figure 4.
Photosynthetic parameters derived from response of A to [CO2] using a biochemical model of photosynthesis (see methods). Each day (August 1 and August 15) was analyzed separately with a mixed model ANOVA. Line 11 and line 30 differed only for V/J on aug 1st (*) and were pooled for all other analyses and post hoc tests. Bars are means (± se) (August 1 n = 3) (August 15 n = 4). Bars with different capital letters are significantly different see results for specific p values).

