
Figure 4.
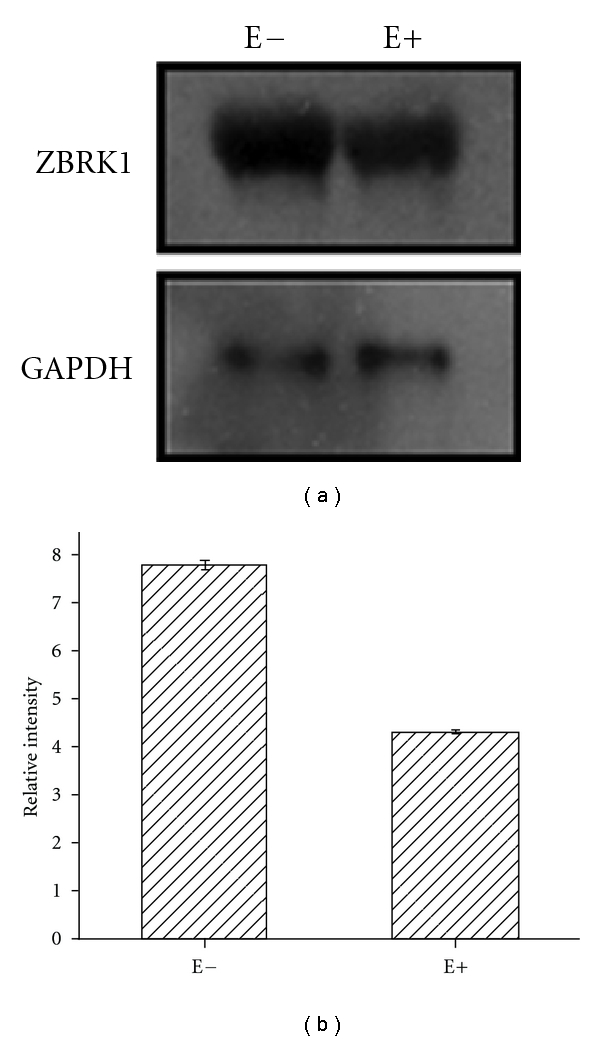
(a) Western blot of ZBRK1 in endothelial cells of estrogen receptor negative (E−) and estrogen receptor positive (E+) breast cancer tissues. (b) Bar diagram showing the relative intensity of ZBRK1 in estrogen receptor negative (E−) and positive (E+) tissues as compared the GAPDH control. ImageJ software was used for densitometric analysis and error bars represents standard error.