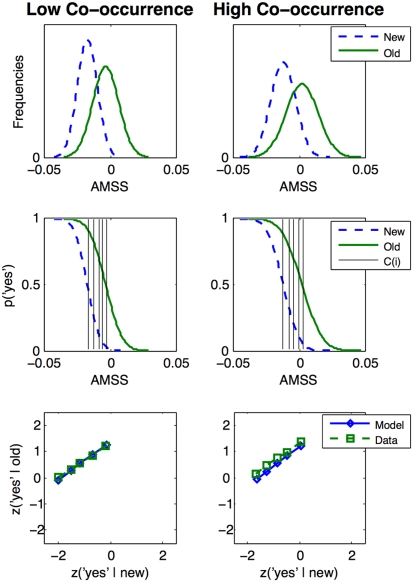
Figure 2.
Distributions of the AMSSs and the resulting z-ROCs for the low (left panels) and high co-occurrence conditions (right panels). The first row displays the associative memory signal strength (AMSS) distributions transformed to smoothed probability density functions for the four experimental conditions. The second row depicts these functions transformed into cumulative “yes”-response probabilities and the five response criteria C(i) for i = 1–5. The third row shows the empirical and modeled z-ROCs.

