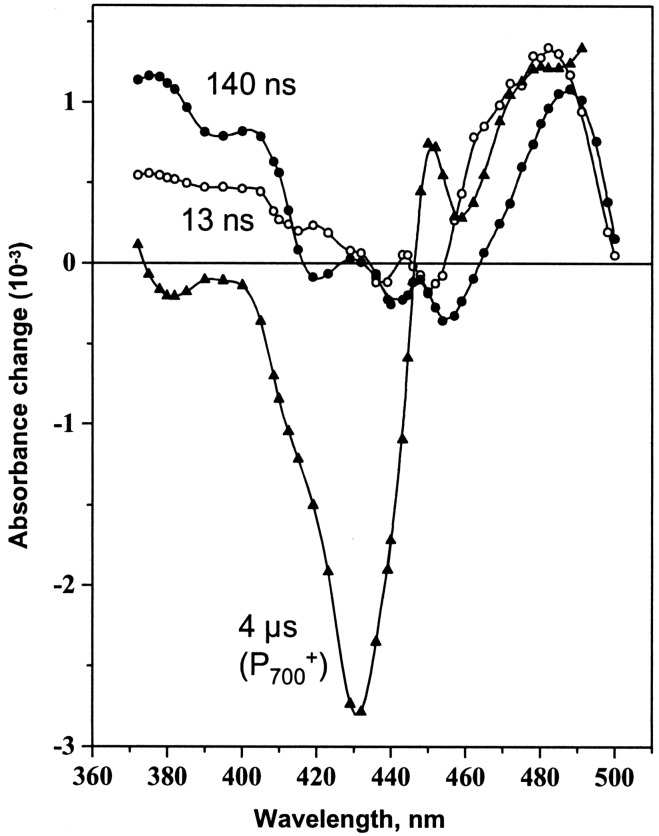
Figure 3.
Decay associated spectra of the 13 ns (○), 140 ns (●), and 4 μs (▴) components, obtained from global analysis of transient absorption data in whole cells of the C. reinhardtii control strain. Flash-induced kinetics in the 5 ns-30 μs time range were measured at each wavelength to obtain the three exponential components. Deconvolution with more exponential components did not improve the results.

