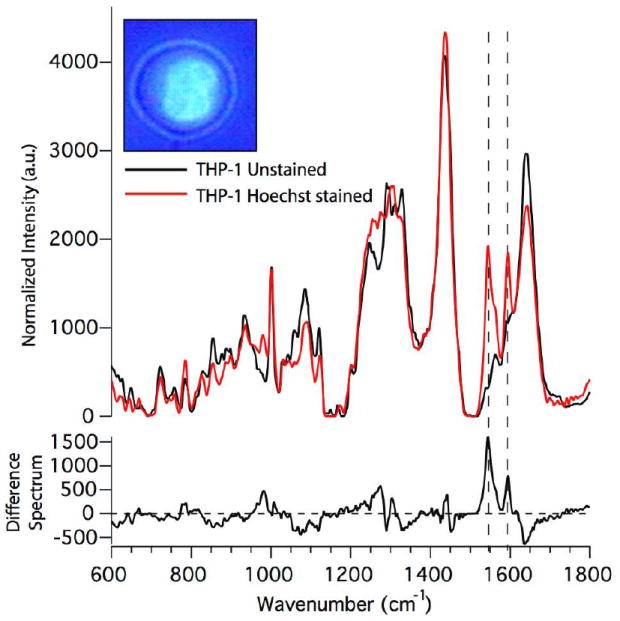
Figure 4.

Raman spectra obtained from optically trapped monocytes without Hoechst stain and after treatment with 10 μg/mL Hoechst stain and their difference spectra. Inset shows a mixed fluorescence and transmitted light micrograph of a THP-1 transformed monocytes treated with Hoechst stain. (Hoechst dye preferentially stains the nucleus of living cells.). The dashed lines indicate those Raman modes that are most notably affected by loading the cell with the Hoechst dye.
