
Figure 5.
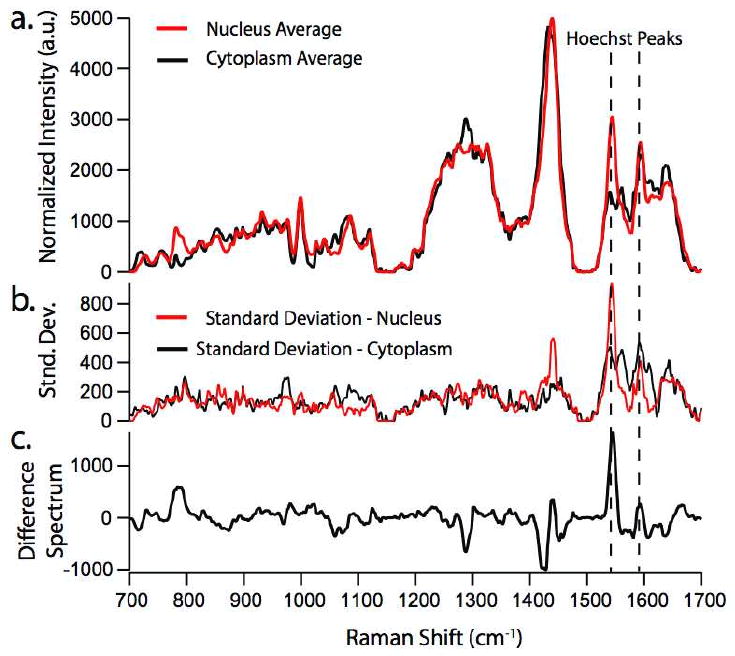
a) Raman spectra obtained from monocytes treated with 10μM Hoechst 33342 adhered to a fused silica coverslip. This allows the isolation of spectra from the cytoplasm of the cell (black trace) and the nucleus (red trace) of the cell. b.) Standard deviation from the averaged spectra shown in a. c.) Difference spectra calculated by subtracting averaged spectrum of cytoplasm from that of the nucleus.