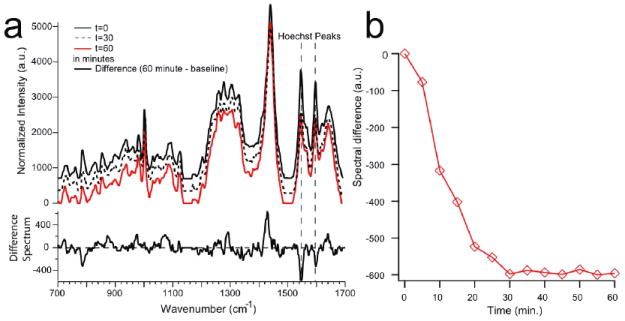
Figure 6.

a) Raman spectra obtained from different time points of a single optically trapped Hoechst-stained THP-1 monocyte. A single cell was held in the optical trap for 60 minutes and spectra were obtained every five minutes. Shown here are select time points, i.e. baseline (or zero time point), 30 minutes, and 60 minutes. Also shown is the difference spectrum between the final (60 minute) and initial (zero time) point. Spectra are offset along the y-axis for better visibility. B) Plot showing the reduction in signal of the 1543 cm-1 Hoechst peak after the dye has been flushed out of the buffer solution surrounding the cells.
