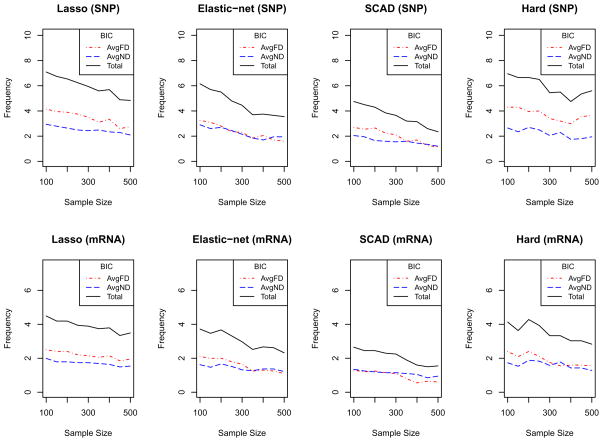
Figure 4.
For each sub plot, the X-axis represents the sample sizes and the Y-axis represents the values. Top four plots are for SNPs and the bottom four plots are for mRNA variables. In each plot, the red and blue dotted lines represent the average number of false discovery (AvgFD) and average number of non discovery (AvgND), respectively, and the solid line represents the average total discordance.

