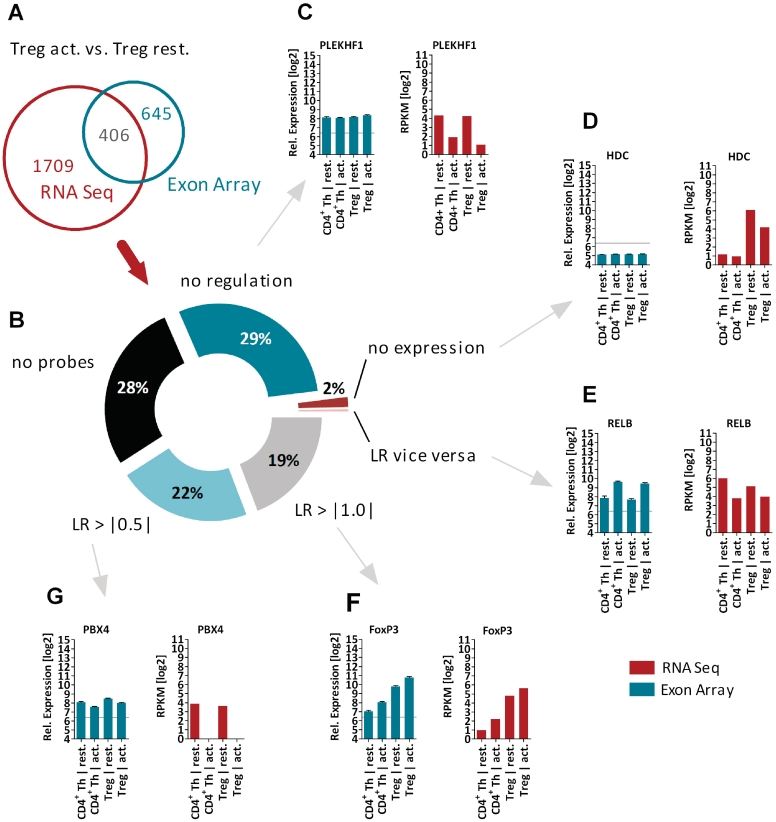
Figure 2.
Technology comparison of differentially expressed genes (Treg act. versus CD4+ Th cells). (A) Venn diagram for 2115 genes identified to be regulated by RNA-seq. Only 406 genes (19%) have been identified by the Affymetrix Exon Array technology, i.e. FoxP3 (F). (B) Analysis of reasons for not being detected by array technology. Of genes, 29% showed no regulation, i.e. PLEKHF1 (C); for 2% of genes no significant expression was detectable, i.e. HDC (D); only 42 genes showed a vice versa regulation pattern, i.e. RELB (E); 22% of genes the regulation could be confirmed by using a lower cuf-off for de-regulation (LR < |0.5|), i.e. PBX4 (G) and for 29% of genes no probeset was annotated at the Core data set using the Affymetrix Exon Arrays. The bar chart diagrams show in red for RNA-seq (in log2 RPKM values) and in green for Affymetrix Exon arrays (in log2 values of RMA normalized expression) the relative expression pattern for all profiled T cell populations. RPKM = reads per kilobase of exon per million mapped sequence reads, LR = Log2 ratio.

