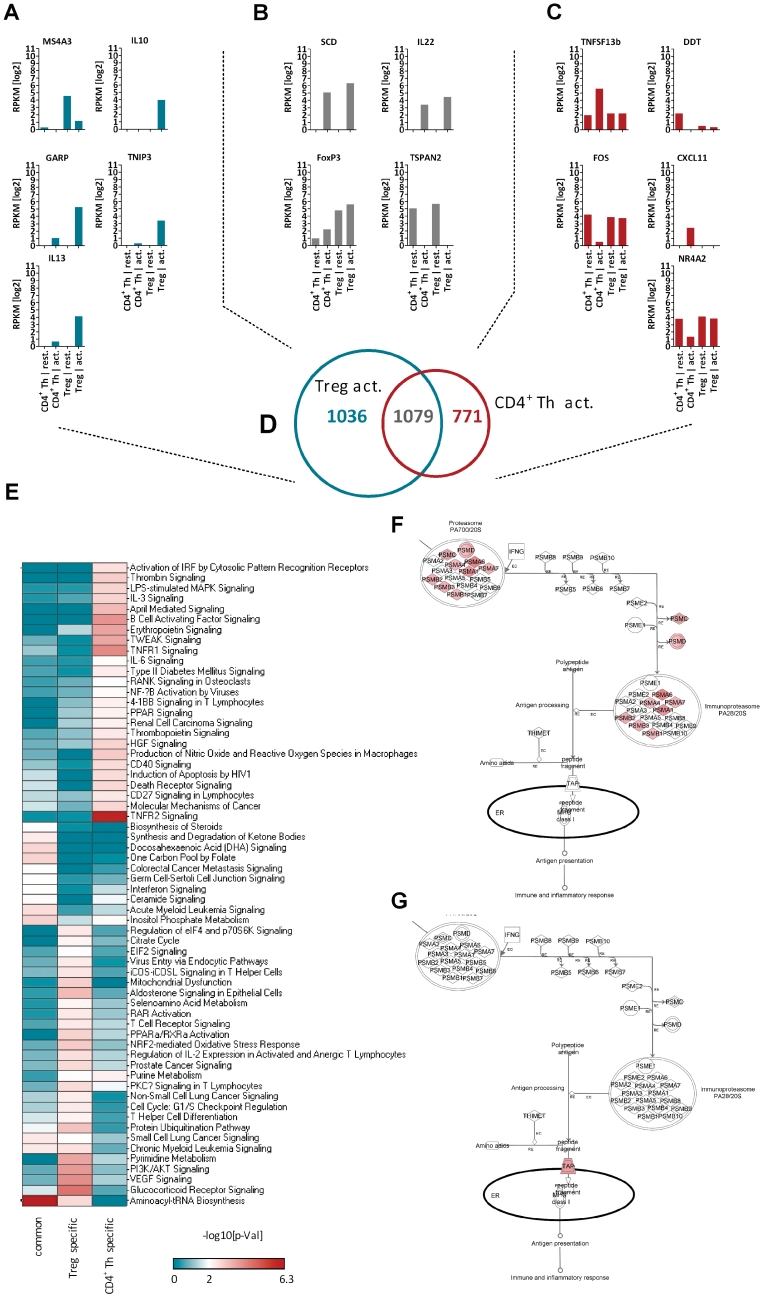
Figure 3.
Pathway Analysis of T cell activation. Shown are (A) genes specifically regulated upon activation of Treg cells. (B) Genes commonly regulated upon activation in both cell populations and (C) genes specifically regulated upon activation of CD4+ Th cells. (D) The Venn diagram shows the intersection of the activation signatures of CD4+ Th and Treg cells. (E) The three activation-specific genesets shown in Venn diagram have been used in Ingenuity Pathway Analysis to enrich influenced signaling pathways. Sixty two canonical signaling pathways scored with a significant −log10[P-value] > 2 for at least one of the three genesets. (F) The overlay of the epression data as LRs to the Protein Ubiquitination Pathway identified a couple members of the protease to be specifically up-regulated in activated Tregs, whereas no modulation of these has been observed after activation of CD4+ Th cells (G). The bar chart diagrams show the relative expression pattern for all in RNA-seq experiments profiled T cell populations in log2 RPKM values. RPKM = reads per kilobase of exon per million mapped sequence reads, LR = Log2 ratio.

