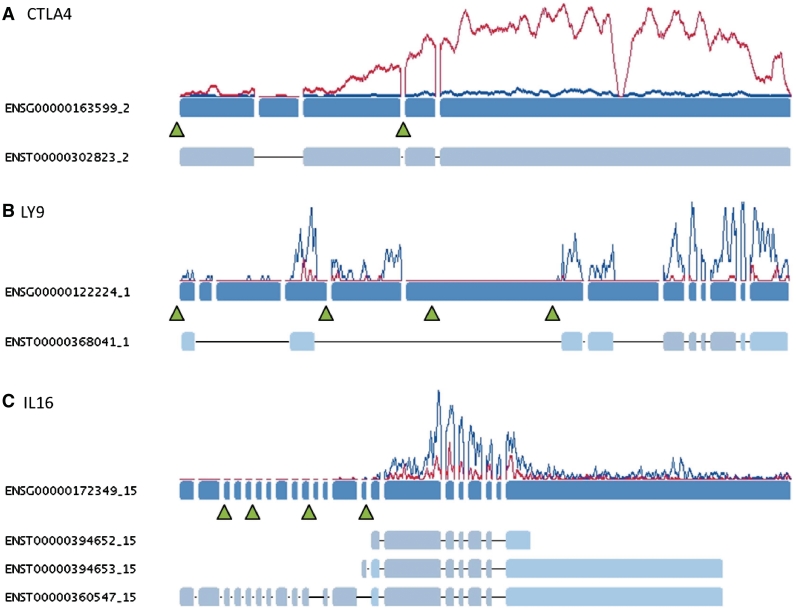
Figure 8.
Examples for the modulation of transcript expression by FoxP3. Exons of the genes are shown in blue, read coverage at a specific position is indicated by the red (activated Treg cells) and blue (activated CD4+ Th cells) lines. Examples for known transcript models of a gene are shown below the gene structure. Green arrows indicate positions of significant FoxP3 binding site peaks identified in activated Treg cells of both donors. (A) shows the up-regulation of CTLA4 likely mediated by two FoxP3 clusters, (B) LY9 is bound by FoxP3 at multiple sites in both cell lines but binding strength is 10× higher in Treg than in CD4+ TH cells, leading to the almost complete repression of the gene in Treg cells, (C) Short isoforms of the IL16 gene are known to be specifically expressed in T-cells. Expression and repression of the short variant of the gene may be mediated by FoxP3 which is bound to multiple sites of the gene including the promoter site of the short isoform in both cell types.

