Figure 4.
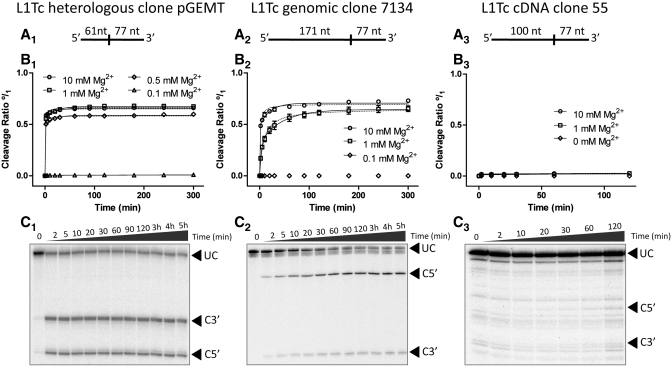
Ribozyme kinetics. pGEM-T easy −61/L1Tc+77 (A1), clone 7134–171/L1Tc+77 (B1) and clone 55–100/L1Tc+77 (C1) uncleaved RNAs were gel purified for cleavage reaction assays. The cleavage point (vertical line) and the expected size of the cleavage fragments are also represented in (A). Cleavage reactions were performed at 37°C at different Mg2+ concentrations. The result of the quantification of triplicates of each reaction is represented in (B1), (B2) and (B3) and the data are fitted to both a two-phase decay curve (solid line) and a hyperbolic one (dotted line). The cleavage rate is represented from 0 (minimum) to 1 (maximum) indicated as (°/1). Autoradiographs of an example kinetic of each assayed RNA at 1 mM Mg2+ is shown in (C). Arrowheads indicate the uncleavaged RNAs (UC), and the 5′- (C5′) and 3′-products (C3′).

