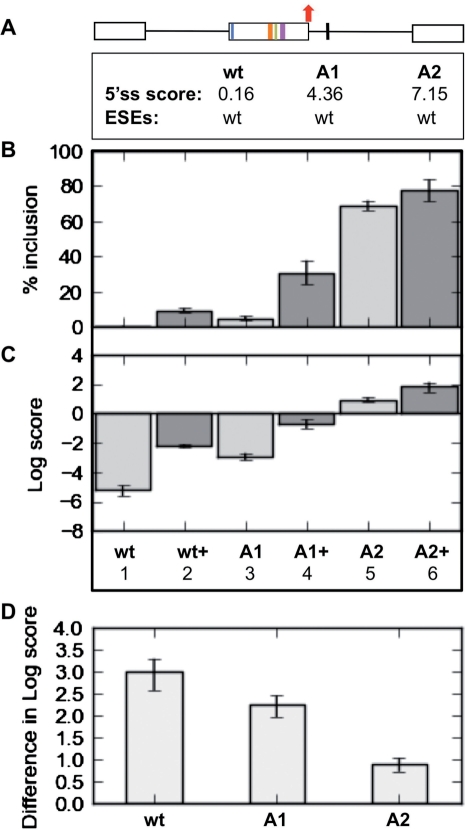
Figure 2.
(A) The splicing response of HIPK3-T to Tra2β correlates with intrinsic exon strength defined by 5′-splice site. Correlation between 5′-splice site strength and splicing response of HIPK3-T in terms of percentage splicing inclusion in response to Tra2β (B), log-score plot for response to Tra2β (C), or difference in log scores (D). A1 and A2 variants have intermediate strength or strong natural 5′-splice site.

