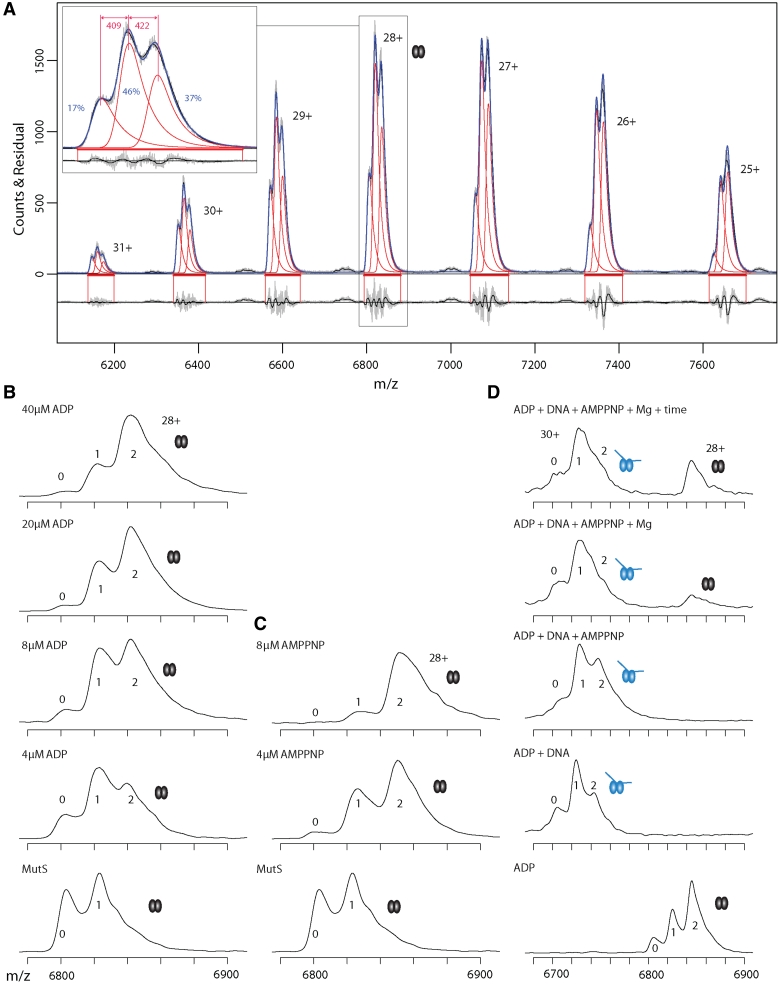
Figure 2.
Native MS resolves asymmetric nucleotide binding by MutS dimers. (A) Mass spectra of 4 µM MutS containing endogenous ADP. Raw and smoothed data (gray and black, respectively) with superimposed onto this the estimated distributions (in blue) obtained from fitting a Gaussian convoluted with a single exponential decay for each separate peak (in red) in the charge state distribution. At the top the actual data is shown, at the bottom the residuals. Horizontal red bars depict the region where the fit is optimized. A close-up of the 28+ ion spectra is shown; the relative abundance of empty MutS and MutS with one or two nucleotide is indicated in blue numbers (calculated for 28+ ion). The mass differences between the first and second species (first nucleotide, 409 Da, ADP) and the second and third species (second nucleotide, 422 Da, ADP) are in red numbers (computed for complete spectrum, not solely 28+ ion). (B) Mass spectra of 4 µM MutS containing endogenous ADP (28+ ion) titrated with ADP (0–40 µM). The ‘0’, ‘1’ and ‘2’ indicate the number of nucleotides bound to a MutS dimer. The low occupancy of the second site indicates the presence of a high and a low binding site for ADP on the MutS dimer. (C) Mass spectra of 4 µM MutS containing endogenous ADP (28+ ion) titrated with increasing concentrations of AMP.PNP (0–8 μM). (D) Mass spectra of 4 μM MutS (28+ ion) titrated with 8 µM ADP, 2 µM mismatched DNA, 8 µM AMP.PNP, Mg2+ and extra incubation time. Mismatched DNA induces dissociation of ADP from one nucleotide binding site. Release of MutS from DNA upon AMP.PNP addition is further improved by Mg2+ and longer incubation. Note the change in m/z scale compared to panel B and C.

