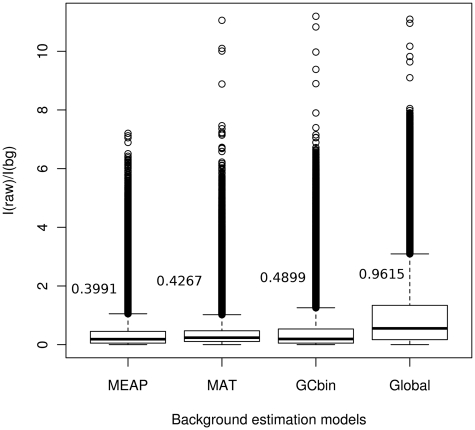
Figure 2.
Boxplot for the ratios of raw intensity of each probe versus estimated background signal. We used human colon cancer exon array data from Affymetrix public resource and calculated signals of antigenomic and genomic background probes on global, PM-GCBG, MAT and PM-BayesBG background correction models. Ideally, the background intensities of these probes from a background model should be the same as their detected signals. MEAP has the lowest mean ratio according to the mean ratios labeled in the figure.

