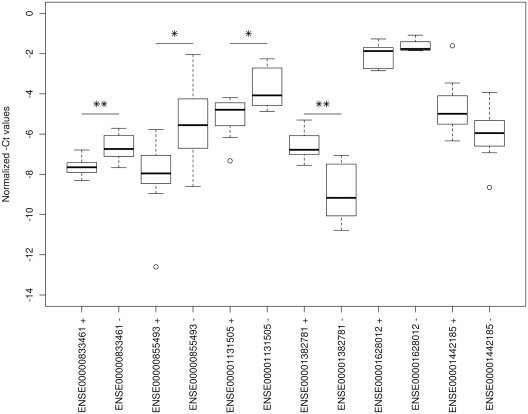
Figure 3.
Boxplot of the normalized −Ct values for randomly selected exons in HNSCC samples. Exons ENSE00000833461, ENSE00000855493, ENSE00001131505 and ENSE00001382781 are statistically significantly differentially expressed between 11q13+ and 11q13− groups (**P < 0.01; *P < 0.05). ○ represents an outlier.

