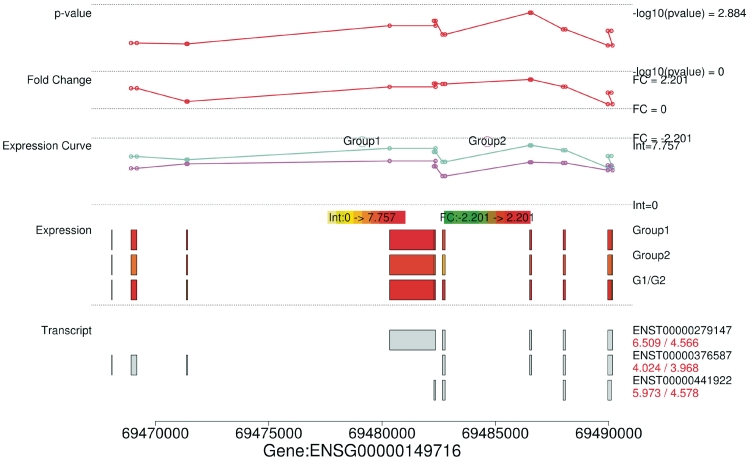
Figure 4.
MEAP splice visualization plot for gene ORAOV1. Top ‘P-value’, ‘Fold Change’ and ‘Expression Curve’ sections display the t-test P-values (− ), fold change (
 ), expression intensities of each exon in a gene between two sample groups (Group1: 11q13+; Group2: 11q13−). Gaps may occur when there are no probes designed against a specific exon region. Sections `Expression' and `Transcript' give the exon expression profile and the expression of each splice variant of ORAOV1 in 11q13+/11q13−. G1/G2 in the exon expression profile corresponds to the fold change between 11q13+ and 11q13− samples, in which green represents downregulation and red represents upregulation. Expression values are on
  -scale.

