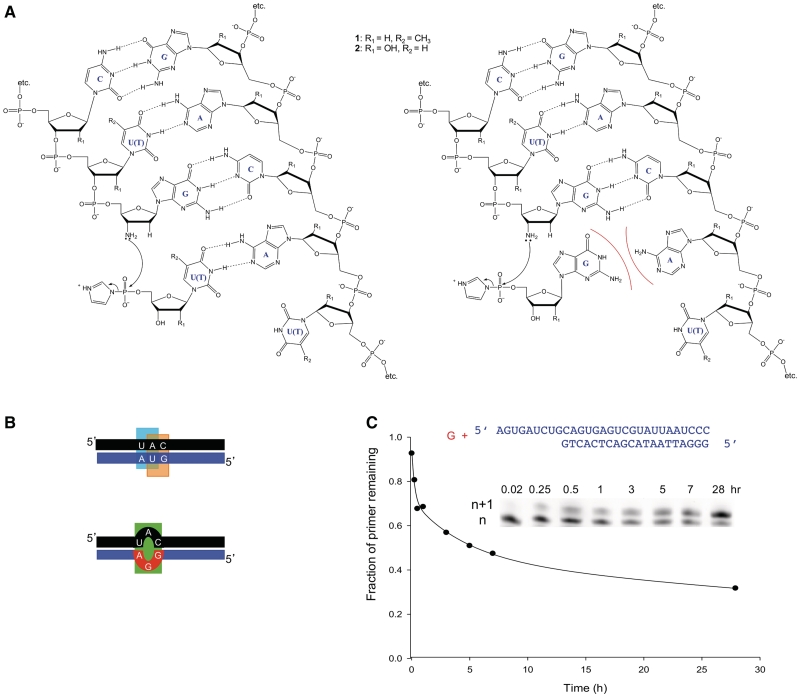
Figure 1.
Experimental and theoretical approaches to determining error rates. (A) Comparison of the experimental reaction rate of correct incorporation (left duplex) versus incorrect incorporation (right duplex). Template strand (right strand within duplex) is either DNA (1) or RNA (2). Primer strand (left strand within duplex) and activated nucleotide are either both DNA analogs (1) or both RNA analogs (2). (B) The free energy of the full-length duplex is calculated as a sum of independent contributions from stacking interactions and other simple structural elements (e.g. mismatches, bulges). Shown here is the comparison between a correctly matched product (top) using nearest–neighbor interactions (cyan and orange boxes) versus a product containing a single mismatch (bottom; green box). This comparison was used as a theoretical estimate for the lowest possible error rate. (C) Example of determination of experimental reaction rate: mis-incorporation of activated nucleotide (ImpdG; red) across template base G in RNA-templated DNA polymerization (blue). Gel image shows extension over time of the original primer (n) by one base (n + 1). Decrease of primer over time is plotted (initial rate = 0.24/h); the line is drawn to guide the eye. Initial rates were used because the reaction slows noticeably over time such that the yield is <100%; this is likely due to spontaneous hydrolysis of the activated monomer under the reaction conditions.

