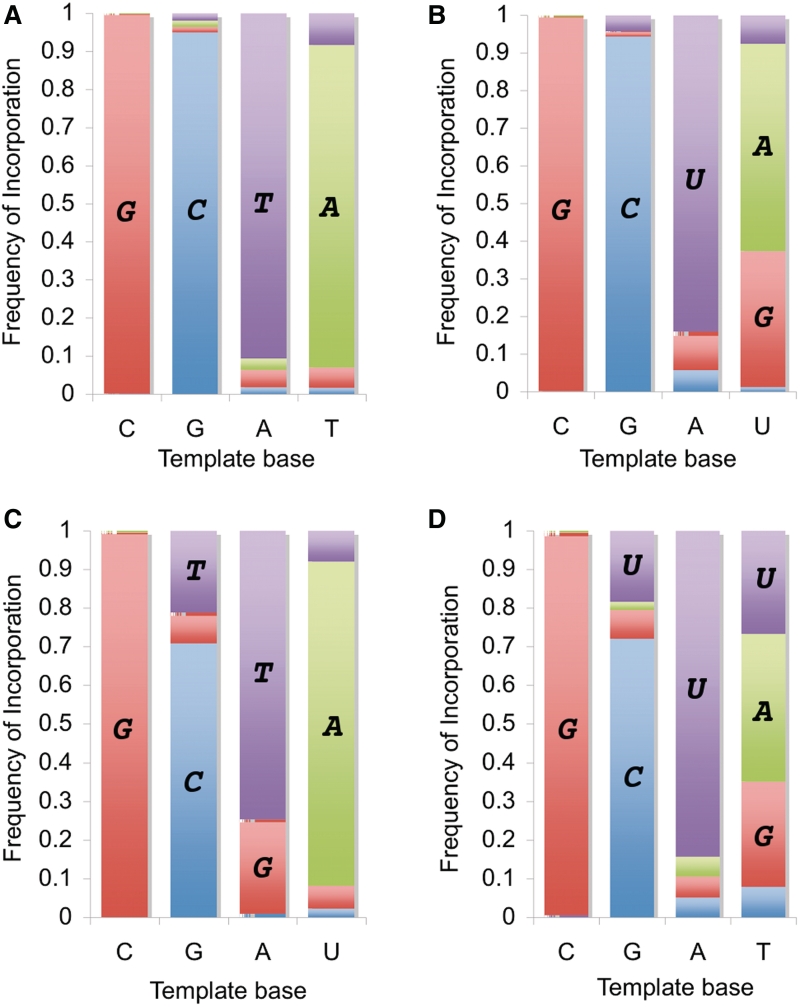
Figure 2.
Experimentally observed frequency of incorporation and mis-incorporation for copying (A) DNA into DNA, (B) RNA into RNA, (C) RNA into DNA, (D) DNA into RNA. Activated nucleotides (ImpN or ImpdN): red = G, blue = C, purple = U or T, green = A. Panel (A) is modified from (18). Substantial frequencies are labeled directly with the incorporated nucleotide in bold italic font within the bar graph.

