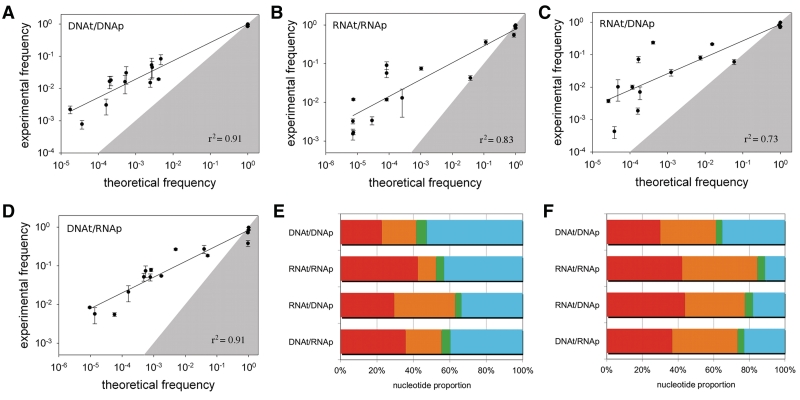
Figure 3.
Experimental incorporation and mis-incorporation frequencies versus thermodynamic predictions for copying (A) DNA into DNA, (B) RNA into RNA, (C) RNA into DNA, (D) DNA into RNA. Lines: linear regression on the log values; r2 values as given. Error bars are from experimental replicates. The gray zones represent the areas in which the experimental frequency would be less than the theoretical frequency; correct incorporations (upper right corner) should lie within the gray zone (i.e. observed fidelity is less than the theoretical maximum) while mis-incorporations should lie outside the gray zone (i.e. observed error frequencies are greater than the theoretical minimum). Nucleotide supply for minimizing experimental (E) or theoretical (F) mutation rates. See Table 4 for values and experimental error bars. Systems are denoted as template/primer. Red = A, orange = C, green = G, blue = T or U.

