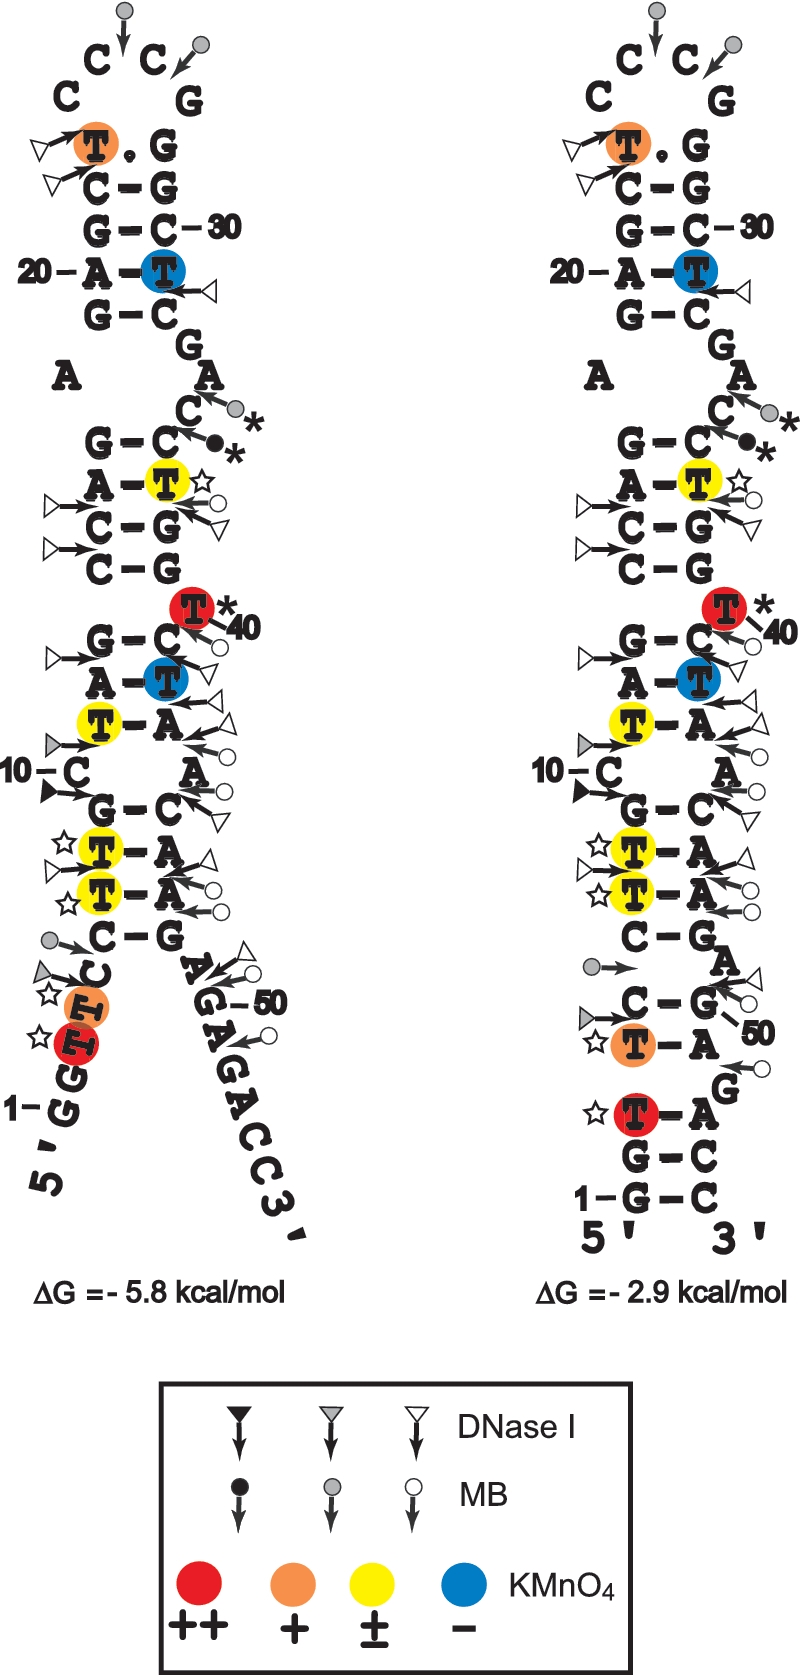
Figure 7.

Secondary structures for the partially melted and closed forms of cTAR. Delta G-values were predicted by mfold. Closed, gray and open symbols indicate strong, medium and weak cleavage sites, respectively, for the various enzymes (triangle for DNase I and circle for mung bean nuclease). The color codes used for the reactivity of thymine residues are indicated in the inset. The strong protections induced by NC at the level of MB cleavage sites and thymine residues are indicated by asterisks. The thymine residues where the reactivity to KMnO4 is increased by NC are indicated by the stars.
