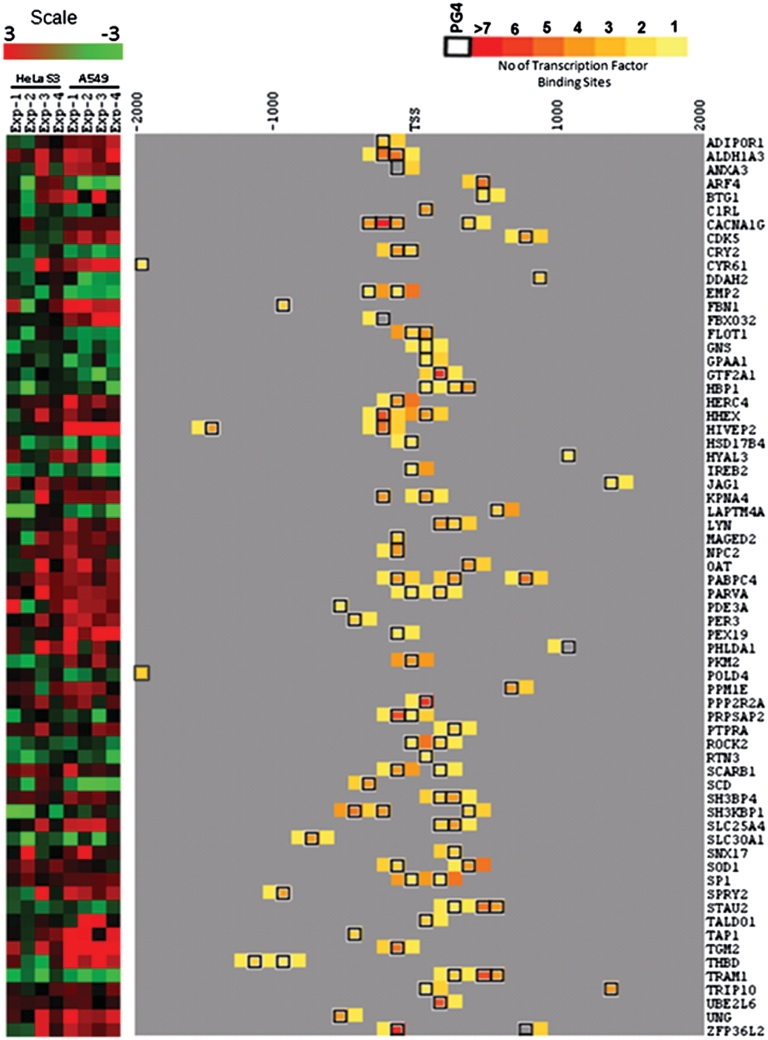
Figure 5.
Genes harboring conserved PG4–TFBS associations are differentially expressed in presence of G-quadruplex binding ligand. Left panel: expression profile of genes with conserved PG4 motif that have significant differential expression in both cell lines on treatment with ligand. Pseudocolor representing their relative expression values in HeLaS3 and A549 cells. Right panel: association of PG4 motif with TFBS in promoters of differentially expressed genes shown in left panel; black box represents PG4 motif and associated pseudocolor shows number of TFBS within 100-base windows relative to TSS.

