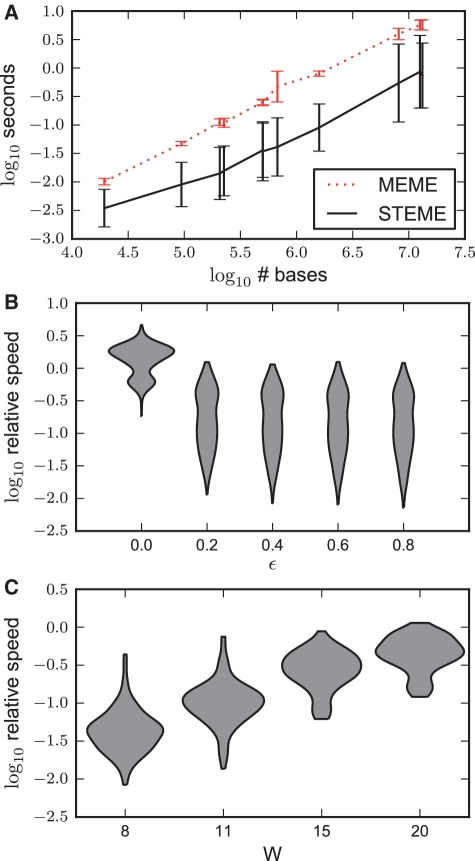
Figure 7.
A comparison of the speed of STEME and MEME on one iteration of the EM algorithm. (A) Using ϵ = 0.4 as a typical setting, the iteration speeds across all the data sets are plotted on a log 10 scale. The error bars represent the standard deviations. (B) A violin plot of the relative speeds of MEME and STEME grouped by ϵ. With ϵ = 0, STEME can be slower than MEME although we would expect this to reverse on larger data sets. As ϵ grows, STEME's advantage grows. The contours of the violin plots are kernel density estimates that are truncated at the minimum and maximum values. The y-axes are on a log 10 scale. (C) Using ϵ = 0.4 as a typical setting, the relative speeds grouped by motif width. For motifs of width 8, STEME is between 10.3 ≃ 2 and 102.1 ≃ 125 times quicker than MEME.

