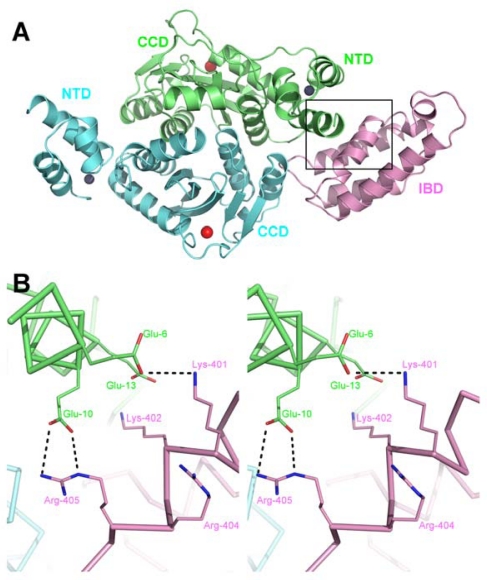
Figure 5.
The interaction between the IBD and IN NTD. A. Cartoon representation of the HIV-2 INNTD+CCD and LEDGFIBD co-crystal structure (PDB ID 3f9k) with the IN dimer colored green (chain A) and cyan (chain B) and LEDGF colored pink. Red spheres represent magnesium ions in the IN active sites and dark grey spheres represent Zn2+ ions coordinated by the HHCC motif of the NTDs. B. Details of the NTD:IBD interface, showing the area enclosed by a black rectangle in A. The charge-charge interactions are shown as black dashed lines between the stick representations of the side chains involved.

