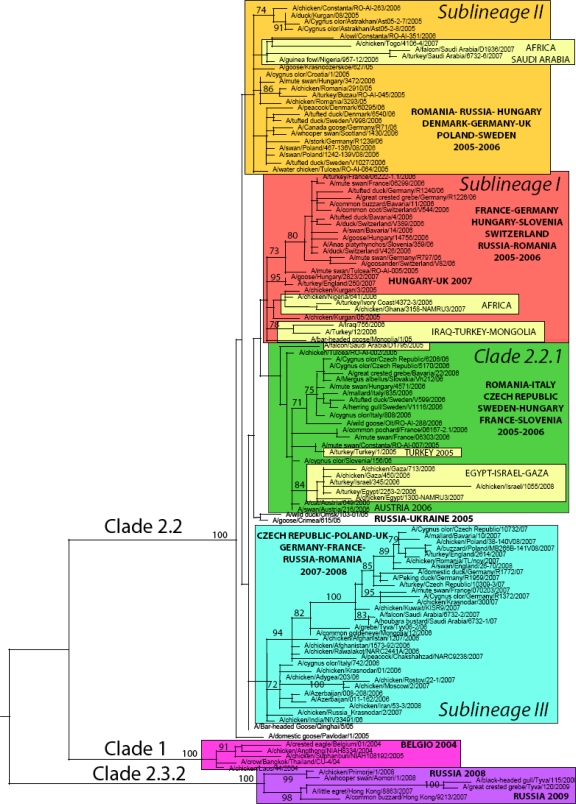
Figure 1.
Maximum likelihood phylogenetic tree of the HA gene of representative H5N1 avian influenza viruses sampled in Europe, Asia, Africa and the Middle East. Coloured rectangles represent three clades (1, 2.2.1 and 2.3.2) and three distinct sublineages of 2.2 clades (sublineages I, II and III). Bootstrap values (>70) are shown for key nodes. All horizontal branch lengths are drawn to a nucleotide substitution per site scale.

