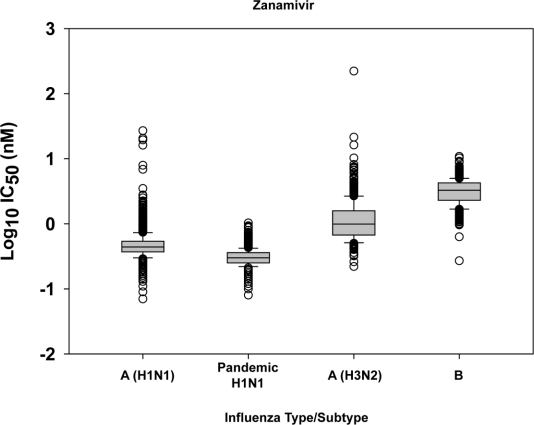
Figure 3.
Box-and-whisker plots showing distributions of log-transformed zanamivir IC50 values for seasonal influenza A(H1N1) (n = 1533), 2009 pandemic H1N1 (n = 2259), seasonal influenza A(H3N2) (n = 834), and seasonal influenza B (n = 914) virus isolates. The boxes represent the 25th to 75th percentiles, and horizontal lines within the box represent median values. The whiskers represent the lowest and highest value in the 25th percentile minus 1.5IQR and 75th percentile plus 1.5IQR regions, respectively.

