Figure 7.
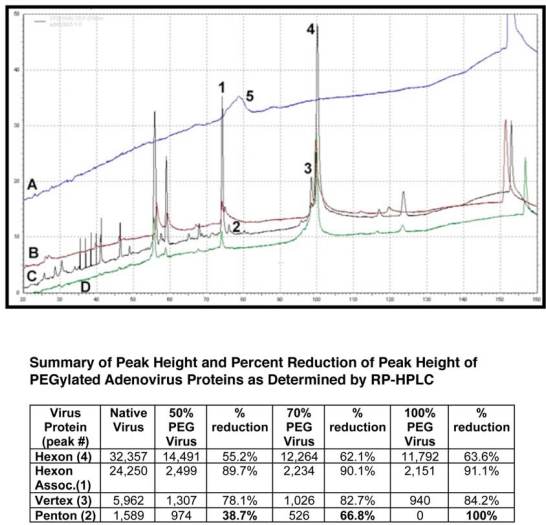
PEGylation Dampens Peak Intensity of Adenovirus Capsid Proteins as Determined by Reverse Phase HPLC. RP-HPLC Chromatograms Showing Peaks of (A) Free PEG; (B) PEGylated adenovirus (50% modification as determined by CE and fluorescamine assays); (C) Unmodified Adenovirus and (D) PEGylated adenovirus (100% modification). Viral proteins were separated on a Jupiter column (250 × 4 mm) packed with a 5 μm diameter, 300 Å pore size C4 resin (Phenomenex) and a pre-column filter (0.5 μm, Phenomenex) at 45 °C. A 145 minute gradient of 0.1% trifluroacetic acid (TFA) in water (Solution A) and 0.1% TFA in acetonitrile (Solution B) was used at a flow rate of 1 ml/min and absorbance measured at 215 nm. Reduction of the peak height of the penton protein (Peak 2) reflects the degree of modification of the virus capsid as determined by fluorescamine and biotin ELISA assays (see table for data summary). This method can also be used to monitor the PEGylation process and confirm results obtained from analysis by capillary electrophoresis (Figure 6). It also verifies that free PEG is removed from the final preparation as is shown by the absence of Peak 5 in all traces.

