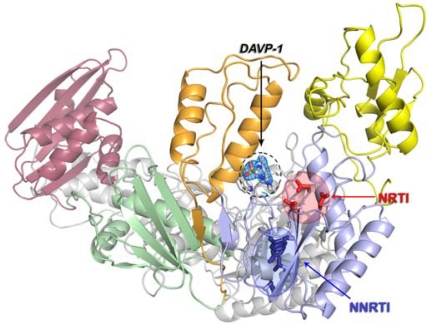
Figure 7.
Overall view of the HIV-1 RT/DAVP-1 complex showing the relative position of binding sites for NNRTI (circled in blue, important residues of the NNIBP are shown as blue sticks) and NRTI (circled in red, the three catalytic D110, D185 and D186 residues are represented as red sticks). The p51 subunit is represented in grey whereas p66 subdomains are color-coded: fingers in yellow, thumb in orange, palm in light blue, connection in green and RNAseH in purple. The electron density map at 2.8 Å resolution is represented around DAVP-1. Residue W266 is also shown as sticks. Adapted from [47].

