Figure 2.
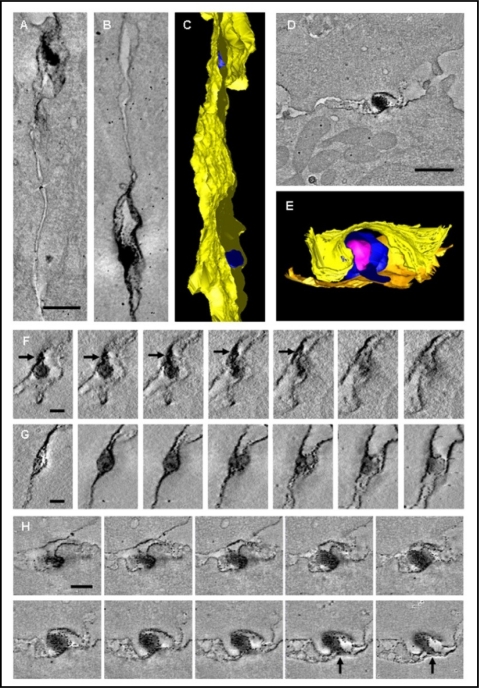
Three-dimensional ultrastructure of the VS. Enveloped HTLV-1 virions are trapped in multiple isolated synaptic clefts. Cell-to-cell transmission of HTLV-1 as observed in tomograms of the VS formed between HTLV-1 infected CD4+ T-cell (PBMC) and an autologous uninfected CD4+ T-cell as a target cell. These cells were stained against HTLV-1 Gag p19 matrix protein with a specific monoclonal antibody. (A, B) Projections along the z-axis of two subvolumes of the same tomogram showing viral transmission at two different locations. (C) Surface representation of the VS shown in (A, B): Several virions (blue) are trapped between the closely apposed plasma membranes (yellow). (D) Tomogram slice showing an HTLV-1 particle held between the cell membranes. (E) Surface representation of the virus transmission shown in D (cell membranes: yellow and orange, virus envelope: blue, virus core: magenta). (F, G) Tomogram slices through the two areas of virus transmission shown in (A) and (B), respectively, with a spacing of about 17 nm (F) and 25 nm (G) between subsequent slices. Black arrows indicate a protrusion linking the virus with the cell membrane. (H) Subsequent slices through the area of virus transmission shown in (D) with a spacing of about 17 nm. Black arrows indicate a protrusion linking the virus with the cell membrane. Scale bars: A, B 300 nm, D 500 nm, F, G 100 nm, H 200 nm. This figure was originally published in PLoS One [41].

