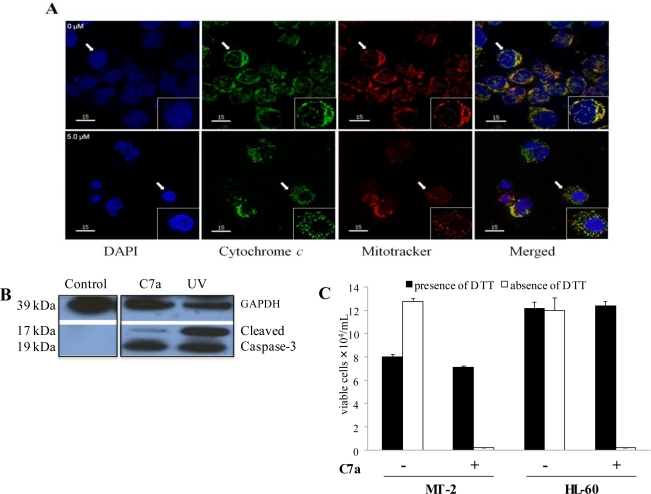
Figure 4.
Mitochondria are involved in C7a induced cell death. (A) Cytochrome c release. HTLV-1 infected MT-2 cells were incubated without (0 μM) or with 5 μM C7a for 3 h. The cells were fixed and incubated with anti-cytochrome c antibody (green). Mitochondria were detected by MitoTracker staining (red), and nuclei were visualized with DAPI (blue). Magnification (×40). Inserts: Single cell indicated by the arrow, magnification (×60). Rare cells treated with C7a that show colocalization of cytochrome c and mitochondria likely reflect the short 3 h exposure to C7a. The assay was repeated twice, and representative images are shown; (B) Caspase Activation. Cell lysates from MT-2 cells before treatment (Control), after treatment with 5 μM C7a for 3 h, or after exposure to 50 J of UV light (UV), as a positive control, were analyzed by Western blotting for cleaved caspase-3 and GAPDH as a loading control. This assay was repeated twice, and representative images are shown; (C) DTT inhibits C7a effect on leukemic human T cells. MT-2 (HTLV-1 infected) and uninfected HL-60 cells (105) were pre-incubated or not with 1 mM of DTT for 1 h. C7a was added to the culture (15 μM to MT-2, 2 μM to HL-60 cells) and incubated for 6 h. Viable cells were counted in presence of Trypan Blue in a hemocytometer. The bars represent the means and SD of three different experiments.

