Figure 1.
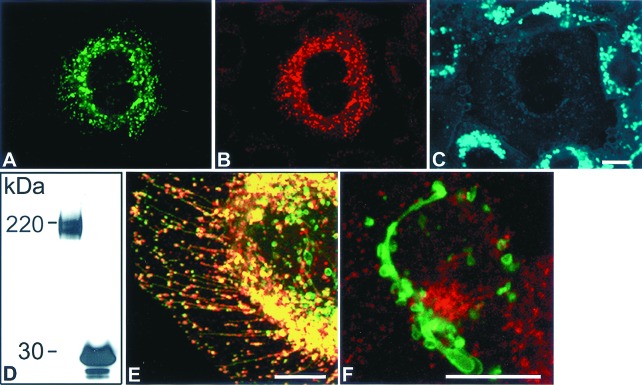
Expression, functional analysis, and subcellular localization of NPC1-GFP in CT60 CHO cells. (A) CT60 CHO cell transfected with NPC1-GFP (green) was (B) immunostained with anti-human NPC1 antiserum (red) and (C) stained with filipin (blue) to visualize cholesterol-loaded lysosomes. (D) Western blot analysis with anti-GFP antibody of total solubilized protein from NPC1-GFP-expressing (Left) and EGFP-expressing (Right) WT CHO cells. The predicted molecular mass of GFP (27 kDa) combined with glycosylated NPC1 (170 kDa and 190 kDa) is comparable to the 200- and 220-kDa bands. Identical results were obtained with total soluble protein from NPC1-GFP transfected CT60 CHO cells (data not shown). (E) Merged image of CT60 CHO cell transfected with NPC1-GFP (green) and immunostained with LAMP2 (red). Colocalization is represented by yellow. (F) Merged image of a NPC1-GFP-expressing WT CHO cell. Cells were transfected with NPC1-GFP (green) and pulsed with Texas Red–transferrin (red) for 10 min. A–C, E, and F are confocal images. (Bar = 10 μm.)

