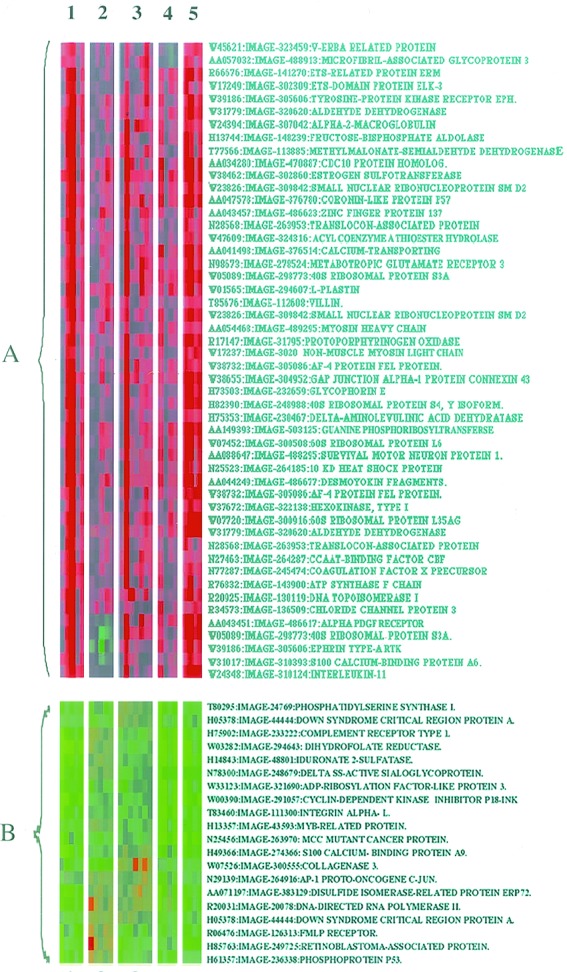
Figure 3.

EGF and ECM treatment provokes similar transcriptional responses. Clustered display of data from HEK293 cells. Cells were attached for 3 h to polyL-lysine (10 μg/ml), fibronectin (10 μg/ml), or laminin (10 μg/ml), and then some cells were stimulated with EGF (10 ng/ml) for an additional hour. CY5- and CY3-labeled cDNAs were prepared and hybridized to cDNA microarrays, as described in Materials and Methods. Microarrays were then subjected to confocal scanning and colored images generated as described (16). Images are labeled with the corresponding treatment identifiers (1, polyL-lysine plus EGF; 2, fibronectin; 3, fibronectin plus EGF; 4, laminin; and 5, laminin plus EGF). Two separate clusters of genes are indicated (subsets A and B), which show similar responsiveness to all of the treatments applied.
