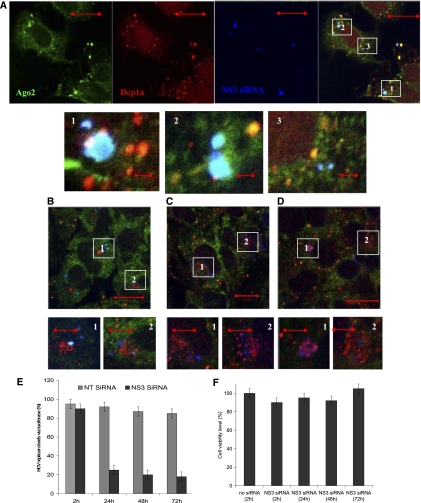
FIGURE 6.
Intracellular localization and activity of NS3 siRNA in Huh7 HCV cells at different intervals post-transfection. (A) In 2 h post-transfection, a fluorescently labeled guide strand of NS3 siRNA (blue) and Ago2 (green) are seen in the colocalizing spots in the cytoplasm. Small Dcp1a (red) spots can be found adjacent (enlargements 1–3). (B–D) In the course of the next 72 h, siRNA and Ago2 spots dispersed into fragmented pattern in the perinuclear area, with increase of Dcp1a punctuate staining at siRNAs sites (B) 24 h; (C) 48 h; (D) 72 h (enlargements 1,2). (E) Inhibition activity of labeled NS3 siRNA was not compromised by labeling. Nontargeting siRNA was used as an unspecific control. (F) Cell viability (measured via Alamar Blue) remained unaffected after transfection and prolonged incubation with labeled NS3 siRNA. Scale bars correspond to 20 μm in full images and 5 μm in enlargements.

