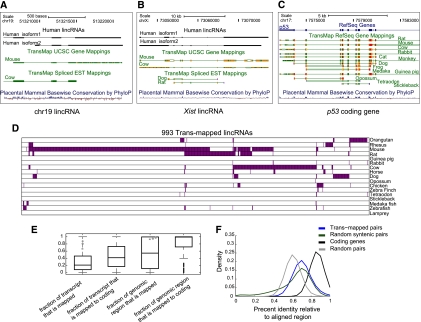
Figure 4.
Orthologous transcripts of human lincRNAs in mammals and other vertebrates. (A) A human lincRNA with syntenic trans-map mappings to mice and cows. Shown are UCSC browser (Kent et al. 2002) tracks showing two isoforms of the human lincRNA (black, top tracks), the mouse and cow transcripts (green, middle tracks) that were trans-mapped to their human locus, and the base-wise conservation calculated by PhyloP at this locus (red–blue, bottom track). (B) Syntenic trans-mapping to XIST. Tracks presented as in A. (C) Syntenic trans-mapping to p53. (D) Species distribution of 993 human lincRNAs with trans-mapped orthologs (columns) and the species in which the trans-mapped transcripts were found (rows, purple). (E) Characteristics of trans-mapping to human lincRNAs. Box plots of the fraction of the human lincRNA transcript that is aligned to an ortholog (first and second boxes) and the fraction of the lincRNA genomic locus covered by the syntenic mapping of the ortholog (third and fourth boxes) for all trans-mapped lincRNAs (first and third boxes) or only for those lincRNAs that were mapped to mouse coding transcripts (second and fourth boxes). The gray square, star, and circle represent XIST, HOTAIR, and the lincRNA shown in A, respectively. (F) Distribution of the percentage of identical bases across the FSA (Bradley et al. 2009) pairwise alignments between human and mouse trans-mapped transcript pairs. (Blue) lincRNAs and their mouse orthologs; (black) human coding genes and their mouse orthologs; (green) randomly selected 1-kb human and mouse syntenic blocks; (gray) random pairing of human lincRNAs and mouse transcripts (from the set marked in blue). All statistics presented in this figure were calculated at the locus level (i.e., each lincRNA loci was accounted for once, rather than accounting for all of its isoforms).

