Figure 5.
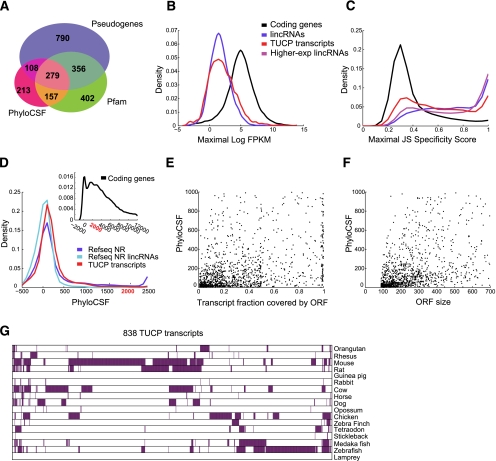
Novel transcripts with potential coding capacity. (A) Characteristics of TUCP transcripts. Shown is a Venn diagram of the 2305 TUCP set transcripts annotated as pseudogenes (purple), containing a Pfam domain (green), having a PhyloCSF score higher than the pipelines set criteria (pink), or combinations thereof. (B) Expression levels of TUCP transcripts. Shown are distributions of maximal expression abundance (log-normalized FPKM counts as estimated by Cufflinks) in TUCP (red), stringent set lincRNA (blue), and coding (black) transcripts. (C) Tissue specificity of TUCP transcripts. Shown are distributions of maximal tissue specificity scores calculated for each transcript in the TUCP set (red), stringent lincRNA set (blue), coding (black), and higher-expressed lincRNAs (magenta) (transcripts defined as in Fig. 2C). (D) PhyloCSF scores of TUCP transcripts. Shown is the distribution of PhyloCSF scores of the TUCP transcripts (red), all noncoding genes in RefSeq (blue), or the subset of RefSeq classified as lincRNA by our pipeline (light blue). (Inset) The corresponding distribution for protein-coding genes that spans a much wider range of positive scores. (E,F) Putative ORFs in TUCP transcripts. Shown are scatter plots of the fraction of each transcript spanned by an ORF (E; X-axis) or of the ORF size (F, in nucleotides; X-axis) versus the PhyloCSF score of that ORF (Y-axis), for the 1404 TUCP transcripts that had a PhyloCSF score >0. (G) Orthologs for TUCP transcripts. Shown are 838 TUCP transcripts (columns) with trans-mapped orthologs and the species in which the trans-mapped transcripts were found (rows, purple).

