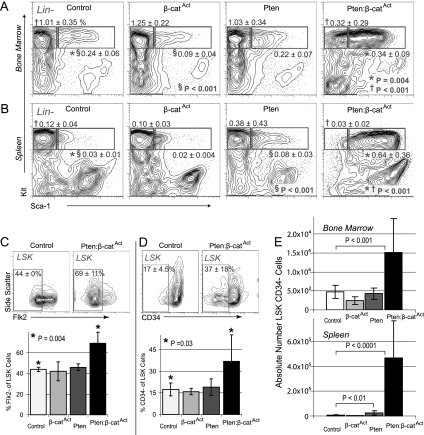
Figure 1.
In vivo expansion of double mutant phenotypic HSCs. (A,B) FACS (fluorescence activated cell sorting) diagrams (pregated for lineage-negative [Lin−] cells) of LSK cells (right blue box) and myeloid progenitors (left blue box) in control, single mutant, and double mutant BM and spleen as indicated at 6 wpi. Mean frequencies are based on total cell number ± SD. (C,D) Frequency of Flk2− and CD34− cells within the LSK population in control, single mutants, and double mutants at 6 wpi. (E) Absolute number of LSK CD34− cells in control, single mutant, and double mutant BM (tibia + femur) and spleen at 6 wpi.

