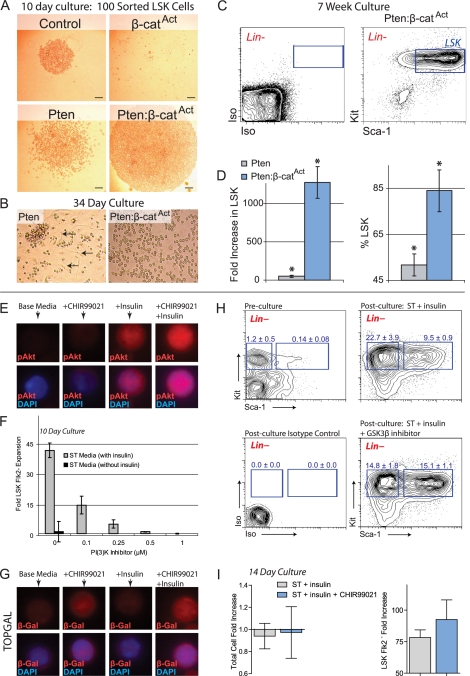
Figure 6.
Simultaneous activation of PI3K and β-catenin signaling increases phenotypic HSC expansion in vitro. (A) One-hundred LSK cells sorted from control, β-catAct, Pten, and Pten:β-catAct mice and cultured for 10 d. (B) LSK cells from Pten and Pten:β-catAct mutants at 34 d of culture. Control cultures do not expand beyond 4 wk; β-catAct mutant cultures do not survive beyond 10 d. Note the greater degree of differentiation, including adherent cells in Pten cultures (arrows). (C,D) At 7 wk of culture, cells from Pten and Pten:β-catAct LSK cultures were counted and analyzed by FACS for maintenance of the LSK phenotype. (C) FACS diagram of 7-wk-cultured Pten:β-catAct LSK cells (pregated on live, Lin− cells) along with isotype control. (D) Total fold increase in LSK cells and percent maintaining LSK phenotype after 7 wk of culture. (E) MNCs were cultured for 7 d in base medium and base medium + CHIR99021 and/or insulin as indicated. LSK Flk2− cells were sorted from these cultures and stained for phosphor-Akt Ser 473 (pAkt). (F) BM MNCs from C57BL/6 mice were cultured for 10 d in ST ± insulin medium along with the indicated concentrations of PI3K inhibitor (NVP-BEZ235) and then analyzed by FACS to determine expansion of LSK Flk2− cells. (G) MNCs isolated from TOPGAL mice were cultured for 7 d in base medium and base medium + CHIR99021 and/or insulin as indicated. LSK Flk2− cells were sorted from these cultures and stained for β-galactosidase (β-Gal). (H) FACS diagrams (pregated Lin− cells) showing preculture and 14-d post-culture analysis of LSK and early progenitor cells with and without addition of lithium. Frequency of early myeloid (left, blue box) and LSK (right, blue box) per total, live cells is shown ± SD. (I) Quantification of total cell and LSK Flk2− cell expansion after 14-d culture of MNCs in ST + insulin medium with and without 250 nM CHIR99021.

