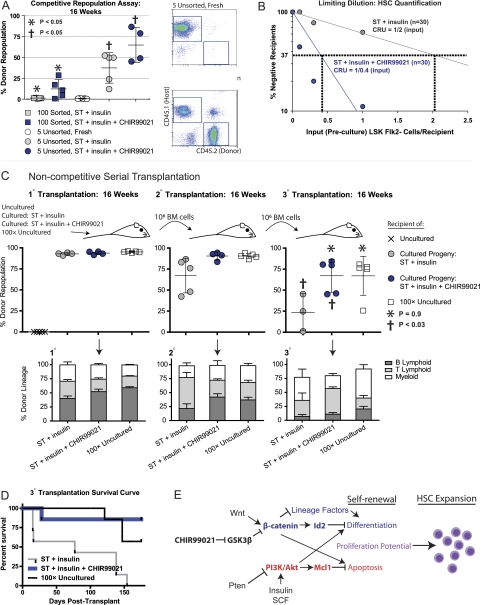
Figure 7.
Functional, long-term repopulating HSCs expanded ex vivo by simultaneous activation of PI3K and β-catenin pathways. (A) Sorted LSK Flk2− cells and unsorted MNCs containing a known quantity of LSK Flk2− cells (CD45.2+) were cultured for 14 d in ST + insulin medium with and without CHIR99021. The cultured progeny of 100 sorted or five unsorted LSK Flk2− cells along with 1 × 10⁵ freshly isolated CD45.1+competitor/rescue cells per mouse were transplanted into lethally irradiated recipients (CD45.1+). Five freshly isolated, unsorted LSK Flk2− cells along with 1 × 10⁵ competitor/rescue cells per mouse were transplanted into a separate group. Peripheral blood of recipients was analyzed at 16 wk post-transplant. (Right) Representative FACS plots depicts percent chimerism. (B) MNCs containing a known quantity of LSK Flk2− cells were cultured for 14 d in ST + insulin medium with and without CHIR99021. The cultured progeny of MNCs initially containing a preculture dosage of 0.1, 0.3, or 1.0 LSK Flk2− cells were transplanted into lethally irradiated recipients along with 1 × 10⁵ rescue/competitor cells (n = 10 for each of six groups). Peripheral blood was analyzed at 16 wk post-transplant, and CRU frequency was determined using L-Calc software (Stem Cell Technologies, Inc.) based on Poisson statistics (Miller and Eaves 1997). (C) Fresh MNCs containing five or 500 LSK Flk2− cells, or the progeny of MNCs initially containing five LSK Flk2− cells cultured for 14 d in ST + insulin medium with and without CHIR90921, were transplanted into lethally irradiated recipients without rescue/competitor cells. At 16–17 wk post-transplant, BM isolated from 1° recipients was transplanted into 2° recipients and, at 16–17 wk after 2° transplant, from 2° into 3° recipients at a dosage of 1 × 10⁶ cells per mouse. Peripheral blood was analyzed for percent donor repopulation at 16 wk after 1°, 2°, and 3° transplant (top panels) and for percent mature donor-derived B, T, and myeloid cells (bottom panels). (D) Kaplan-Meier survival curve for 3° transplant recipients from C. (E) Model illustrating individual and combined effects of Wnt/β-catenin and PTEN/Akt signaling pathway activation driving HSC expansion.

