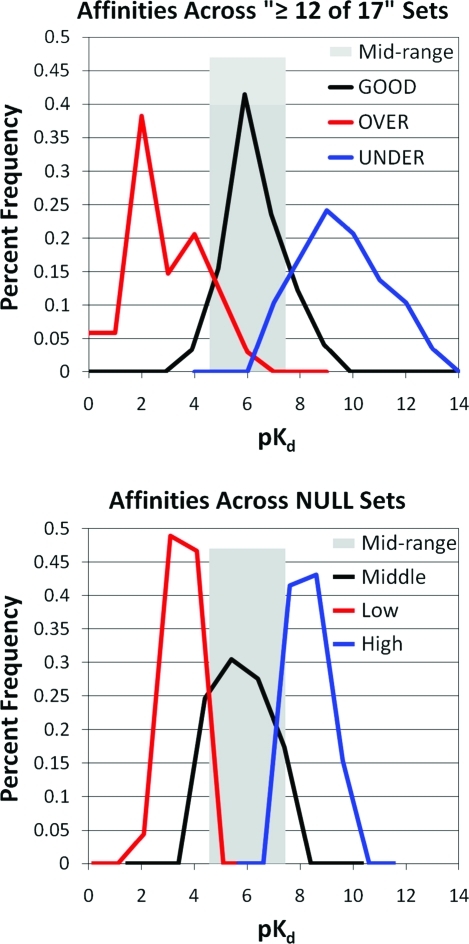
Figure 5.
Distribution of binding affinities in the GOOD and BAD complexes (left) are compared to those of the NULL case (right). The NULL case is generated by the sets of all complexes with affinities ≤50 nM (high), 50 nM–50 μM (middle), and ≥50 μM (low). This midrange of affinities is highlighted with a wide, gray bar on both figures.

