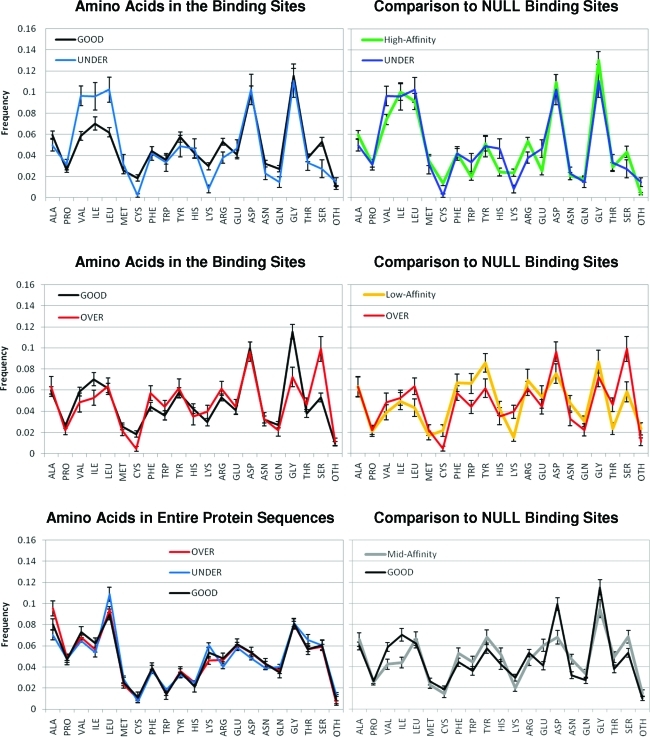
Figure 6.
Distribution of amino acids in the binding sites of the GOOD and BAD complexes meeting the ≥12 of 17 definition (left) are compared to those of the NULL case (right). The graph in the lower left provides the distribution of all amino acids in the full protein sequences to show that the important trends do not result from inherent differences in composition of the proteins (the same is true of the NULLs, data not shown). Metals and modified residues are denoted as other, “OTH”. Averages and error bars for the amino acid content were determined by bootstrapping.

