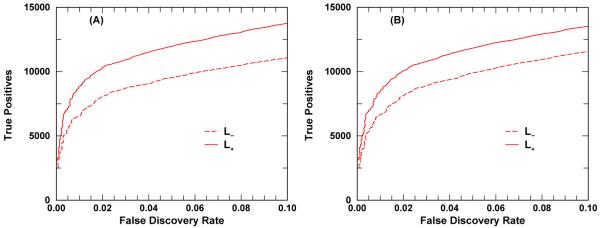
Figure 7.
Enhanced database utility test. The cumulative number of true positives identified is plotted against the FDR, see eq. (5). Panel A (B) displays the results from ISB_Human_Plasma_Q1 (ISB_Human_Plasma_Q0) spectral library data set containing a total of 23, 841 (29, 109) spectra. Since these two spectral data sets were also included for proteotypic annotation, the performance gain indicates some sort of upper bounds rather than typical.

