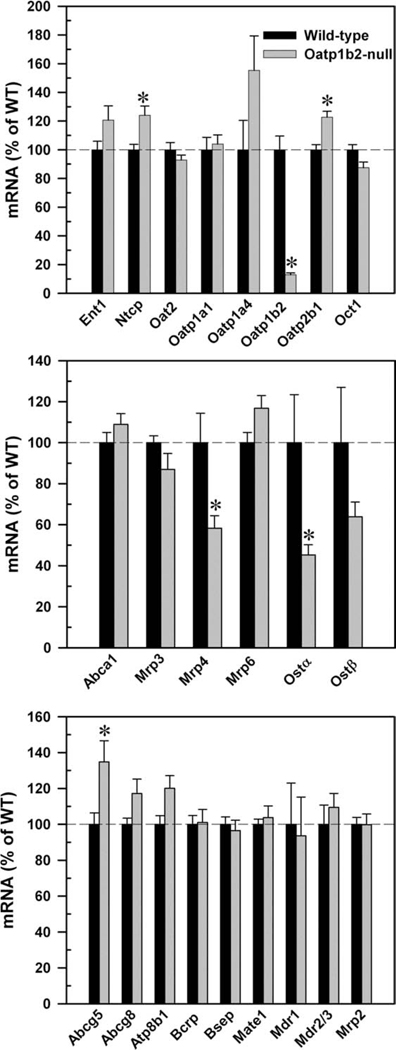
Fig. 6.
mRNA expression of basolateral uptake (top), efflux (middle), and canalicular (bottom) transporters in 2-month-old WT and Oatp1b2-null mouse livers. Bars represent the relative percentage mRNA expression ± SE of 6 mice compared with WT mice values. *Statistically significant difference (P < 0.05) from the respective values of WT mice.

