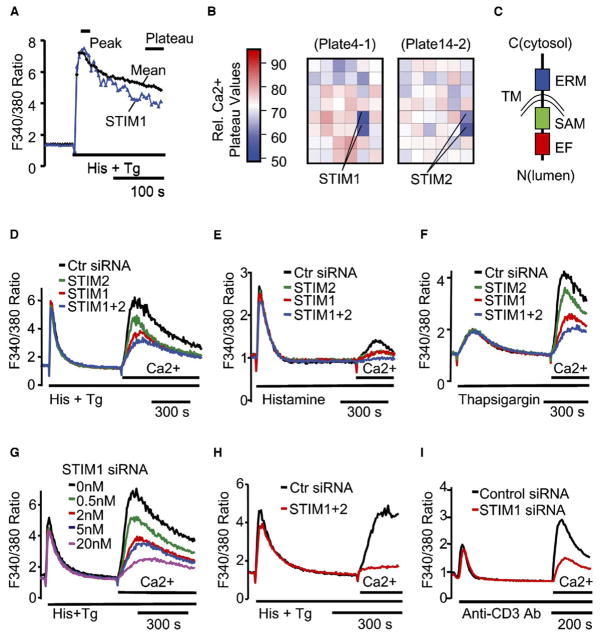
Figure 1. STIM1 and STIM2 Are Identified in a Kinetic Ca2+ Screen for Suppression of SOC Influx with 2,304 Human Signaling siRNAs.
(A) Comparison of the Ca2+ time course in STIM1 knockdown cells to the averaged reference time course. HeLa cells were transfected with the siRNA signaling set at an average concentration of 10 nM for 2 days. Fura-2 Ca2+ time courses were measured in a microplate reader with automated stimulus addition.
(B) Positional heat-map analysis of relative Ca2+ plateau values in the two microplates containing STIM1 and STIM2 siRNA-transfected cells (24 duplicate siRNAs per plate). Relative Ca2+ plateau values were calculated by dividing the plateau (the average of the last 5 data points) by the peak (the average of 3 peak points) fluorescence.
(C) Domain structure of STIM1 and STIM2. Domains include an EF-hand motif (EF), a SAM domain, a single transmembrane domain (TM), and an ERM domain arranged from N to C terminus of both proteins with the C terminus in the cytosol.
(D–F) Suppression of Ca2+ influx by STIM siRNAs measured by “Ca2+ add-back” in HeLa cells transfected with 10 nM STIM1 and/or 10 nM STIM2 siRNA for 2 days. One hundred micromolars histamine plus two micromolars thapsigargin (D), histamine alone (E), or thapsigargin alone (F) was used to deplete Ca2+ stores.
(G) Titration of STIM1 siRNA. Total siRNA concentration was kept at 20 nM for all samples with control siRNA.
(H) Near-complete inhibition of Ca2+ influx in cells transfected for 3 days with 20 nM STIM1 plus 20 nM STIM2 siRNA. Data shown in (D)–(H) are the average of 3 bulk-cell Ca2+ measurements obtained with a microplate reader.
(I) Suppression of T-cell-receptor-triggered Ca2+ influx by STIM1 siRNA. Ca2+ add-back experiments were done in Jurkat T cells transfected with pYFP-Nuc (transfection marker) plus 72 nM STIM1 or control siRNA for 2 days. Ca2+ stores were depleted with 20 μg/ml anti-human CD3 antibody. Shown are the average Ca2+ responses of 48 control and 84 STIM1 siRNA-transfected (YFP-positive) single cells.

