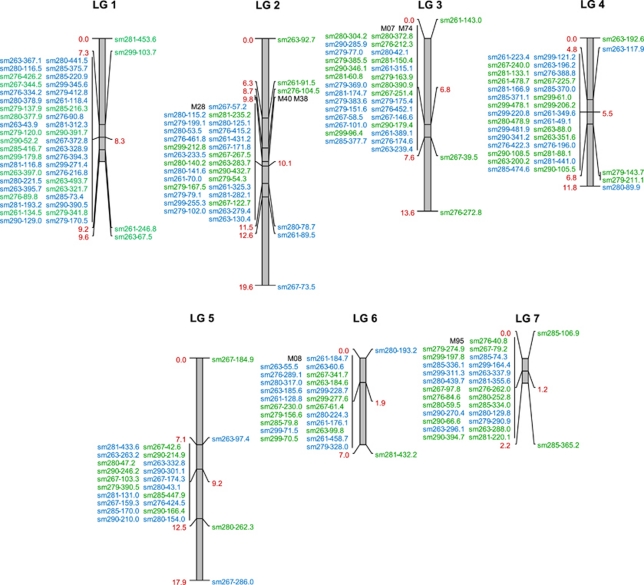
Figure 2.
Integrated AFLP map of Oenothera species. The molecular maps of hjohansen Standard and htuscaloosa are based on the analysis of 488 meioses and 229 molecular markers. Co-dominant markers are marked in black, AFLP markers of hjohansen Standard and htuscaloosa are marked in green and blue, respectively. The size of the chromosomes in centimorgan (red) corresponds to the genetic resolution.

