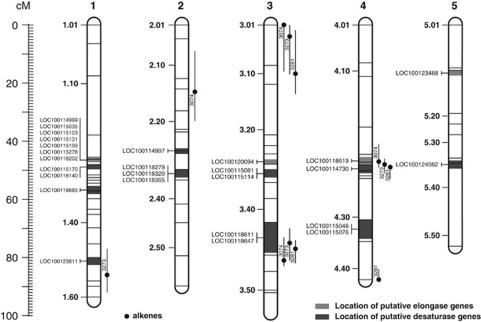
Figure 3.
Nasonia giraulti (♂) × Nasonia vitripennis (♀) recombination map with position of genes with high similarity to the Drosophila genes desat1, desat2 desatF and eoF (dark and light grey shaded areas). The map also shows the estimated positions of predicted QTL for three identified alkenes in the Nasonia CHC profile. As in Figure 2, the retention index (RI) of the corresponding CHC compound (see Table 1), the position of the maximum LOD score, and the 95% Bayes credible interval are given. The five chromosomes are labeled 1–5. Horizontal lines on the chromosomes indicate the position of the 71 genotyped molecular markers. Landmarks next to the chromosomes (1.1–5.50) correspond to those defined by Niehuis et al. (2010).

