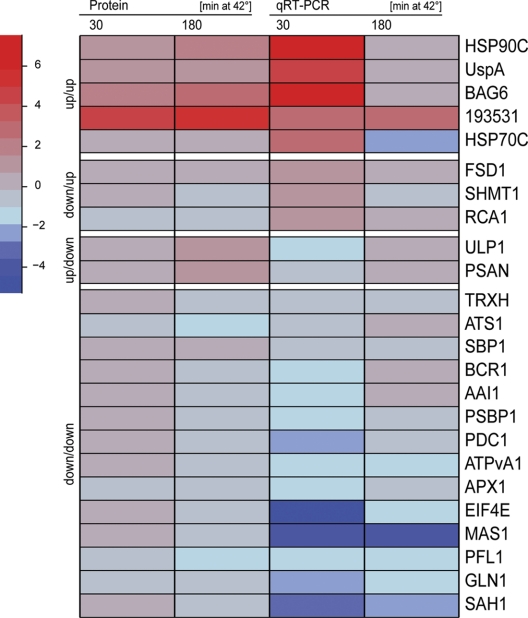
Fig. 6.
Heat map representation of protein and transcript abundance during heat stress. Relative changes in the abundance of transcript levels of 24 selected target genes in Chlamydomonas cells exposed to heat stress for 30 and 180 min were determined by qRT-PCR using the relative 2−ΔΔCt method. Transcripts of the CBLP2 house-keeping gene were used as internal standard. Values are the average of two biological replicates, each measured in triplicate (all values are compiled in supplemental Table S6). For each of the 24 targets the relative changes in protein levels at the two time points, as determined by quantitative shotgun proteomics, are also shown (values are from supplemental Table 3). Fold changes are log2 transformed.

