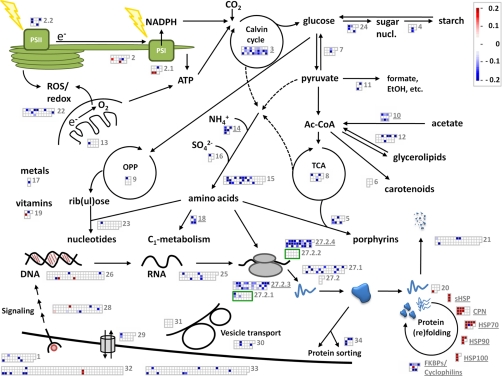
Fig. 8.
Schematic overview of the quantitative shotgun proteomics results. Shown is a crude outline of the biochemical pathways and cellular processes in which most of the 1116 quantified proteins participate. Boxes next to each pathway or process represent the 47 functional bins, bin numbers as listed in Table I are in gray letters. Bins with underlined numbers and names are significantly enriched in proteins changing in response to heat stress with respect to the total protein population. White boxes are proteins that do not change during heat stress or whose changes are not significant. Red boxes represent proteins increasing, blue boxes proteins decreasing during heat stress. The color intensity indicates the magnitude of change.

